Operational Intelligence for Specialty Crop Growers.
Turn verified field data into daily decisions — pace, cost-per-unit, crew assignments, and harvest timing. Labor is your largest controllable cost. We help you manage it.
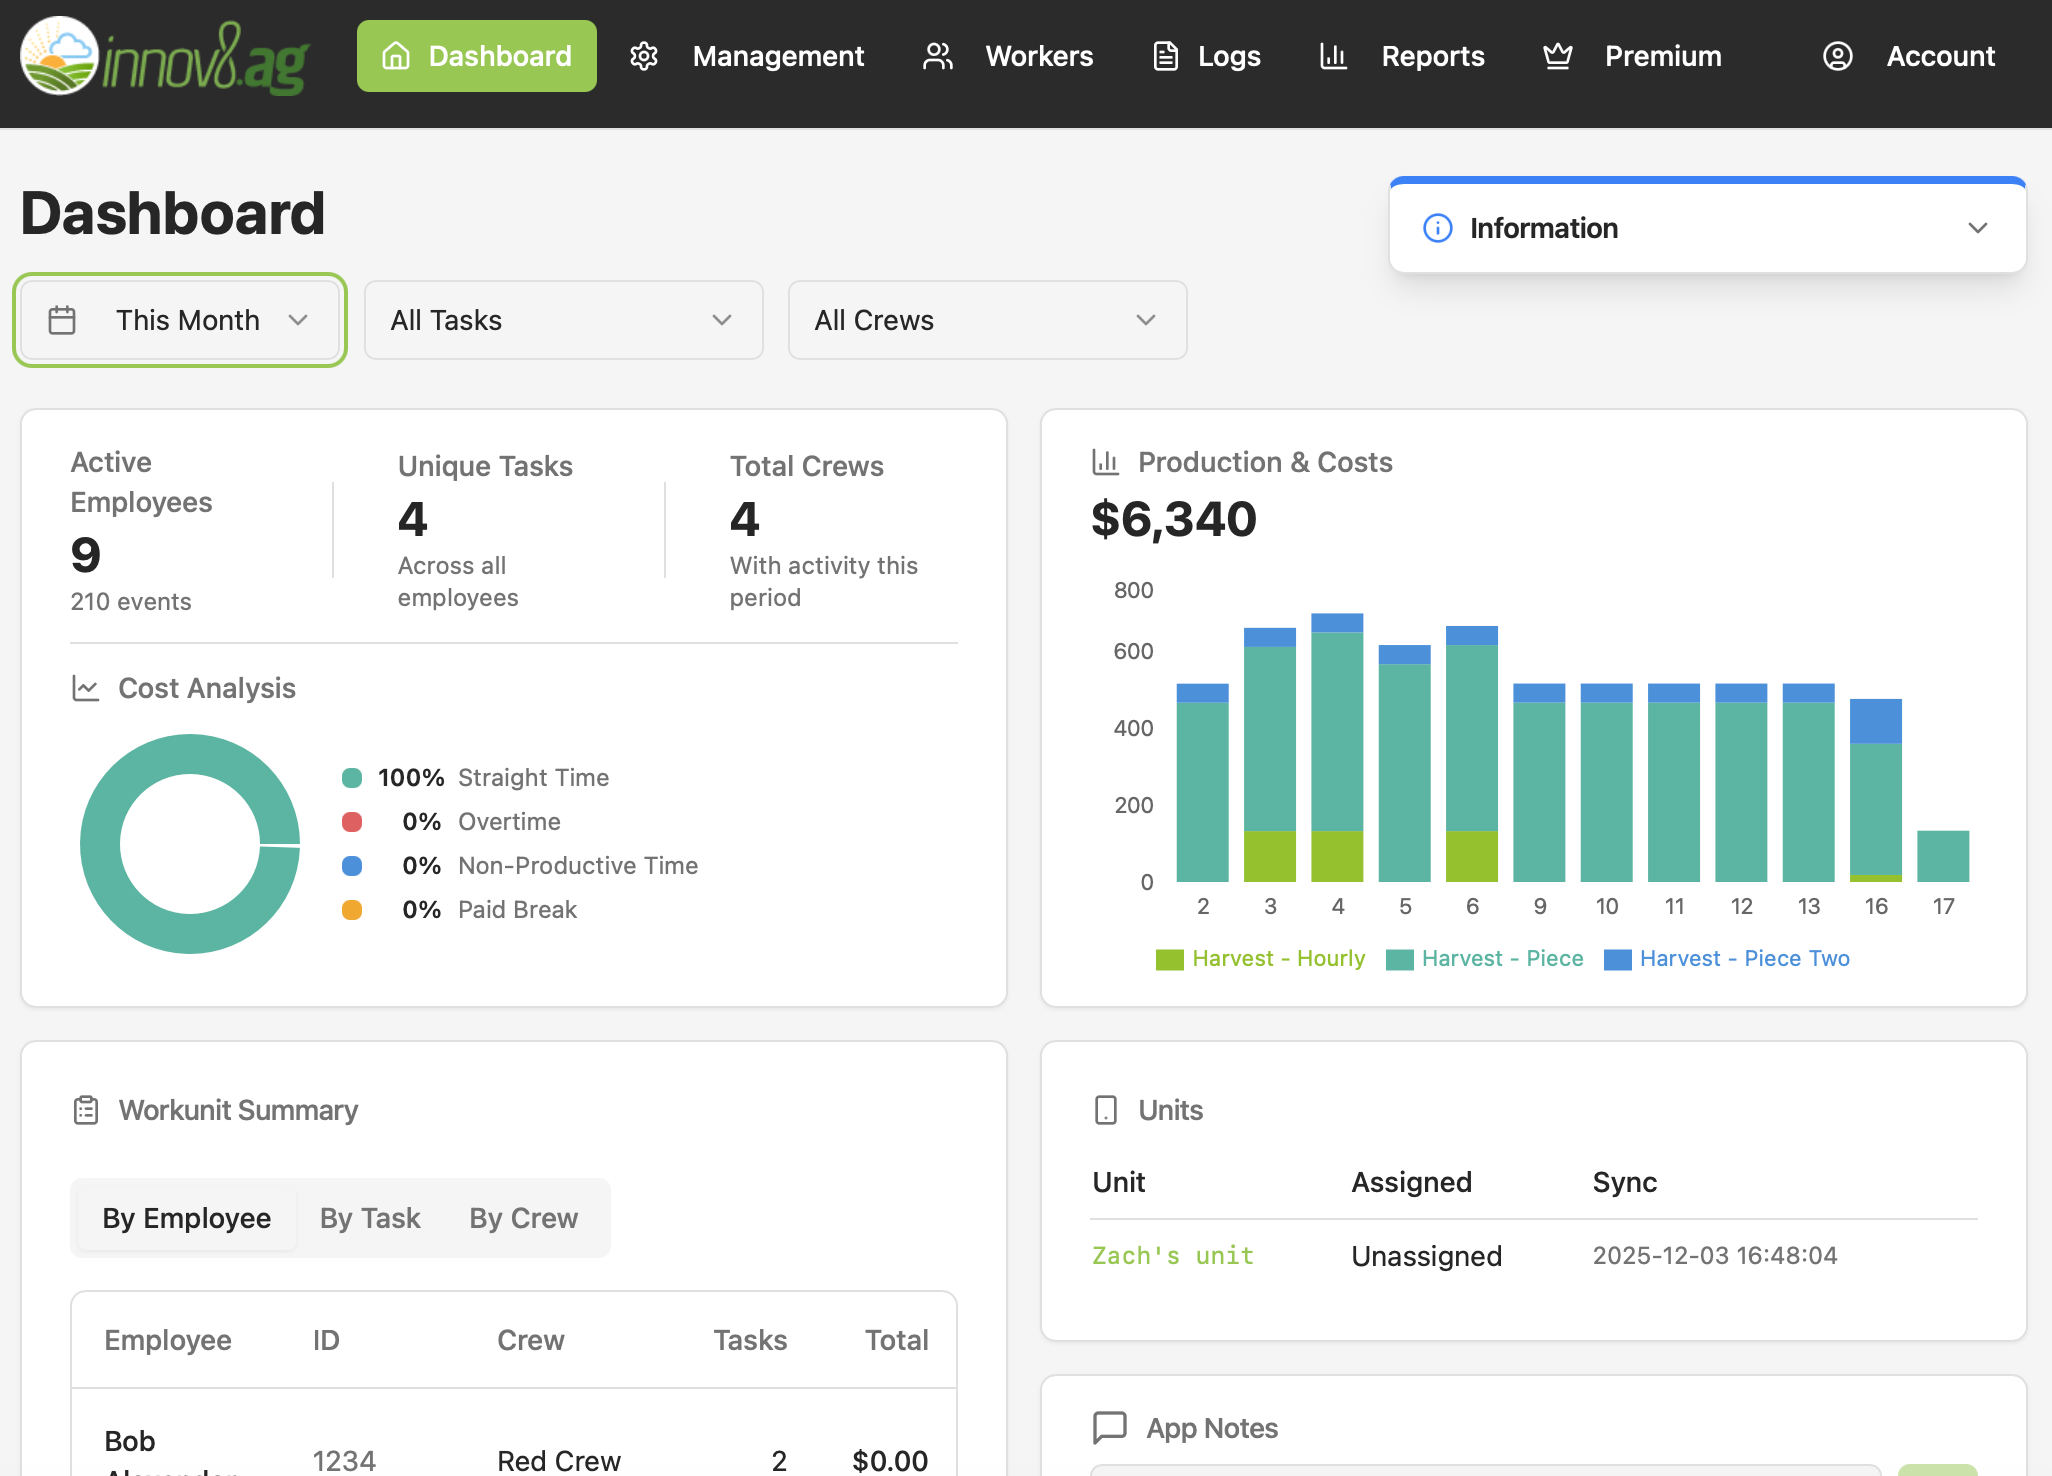
Operational decisioning — pace, bottlenecks, cost-per-unit, and quality timing — updated hour by hour.*
* Requires FairTrak mobile devices with grower-provided SIM/hotspot for in-field data syncs, plus a subscription to the operational analytics feature.
Trusted by specialty crop growers across the U.S. and internationally
Active across U.S. and international specialty crop operations
Research partnerships with WSU, Oregon State, Rutgers, University of Florida & AgAID Institute
Individual results vary. Outcomes depend on operation size, crop type, labor conditions, and other factors.
Apply for the HarvestReplay™ Paid Pilot.
15 slots. $10,000 pilot fee. $20,000 savings guarantee. If your operation doesn’t identify at least $20,000 in operational savings within a year of activation, we refund the pilot fee in full.
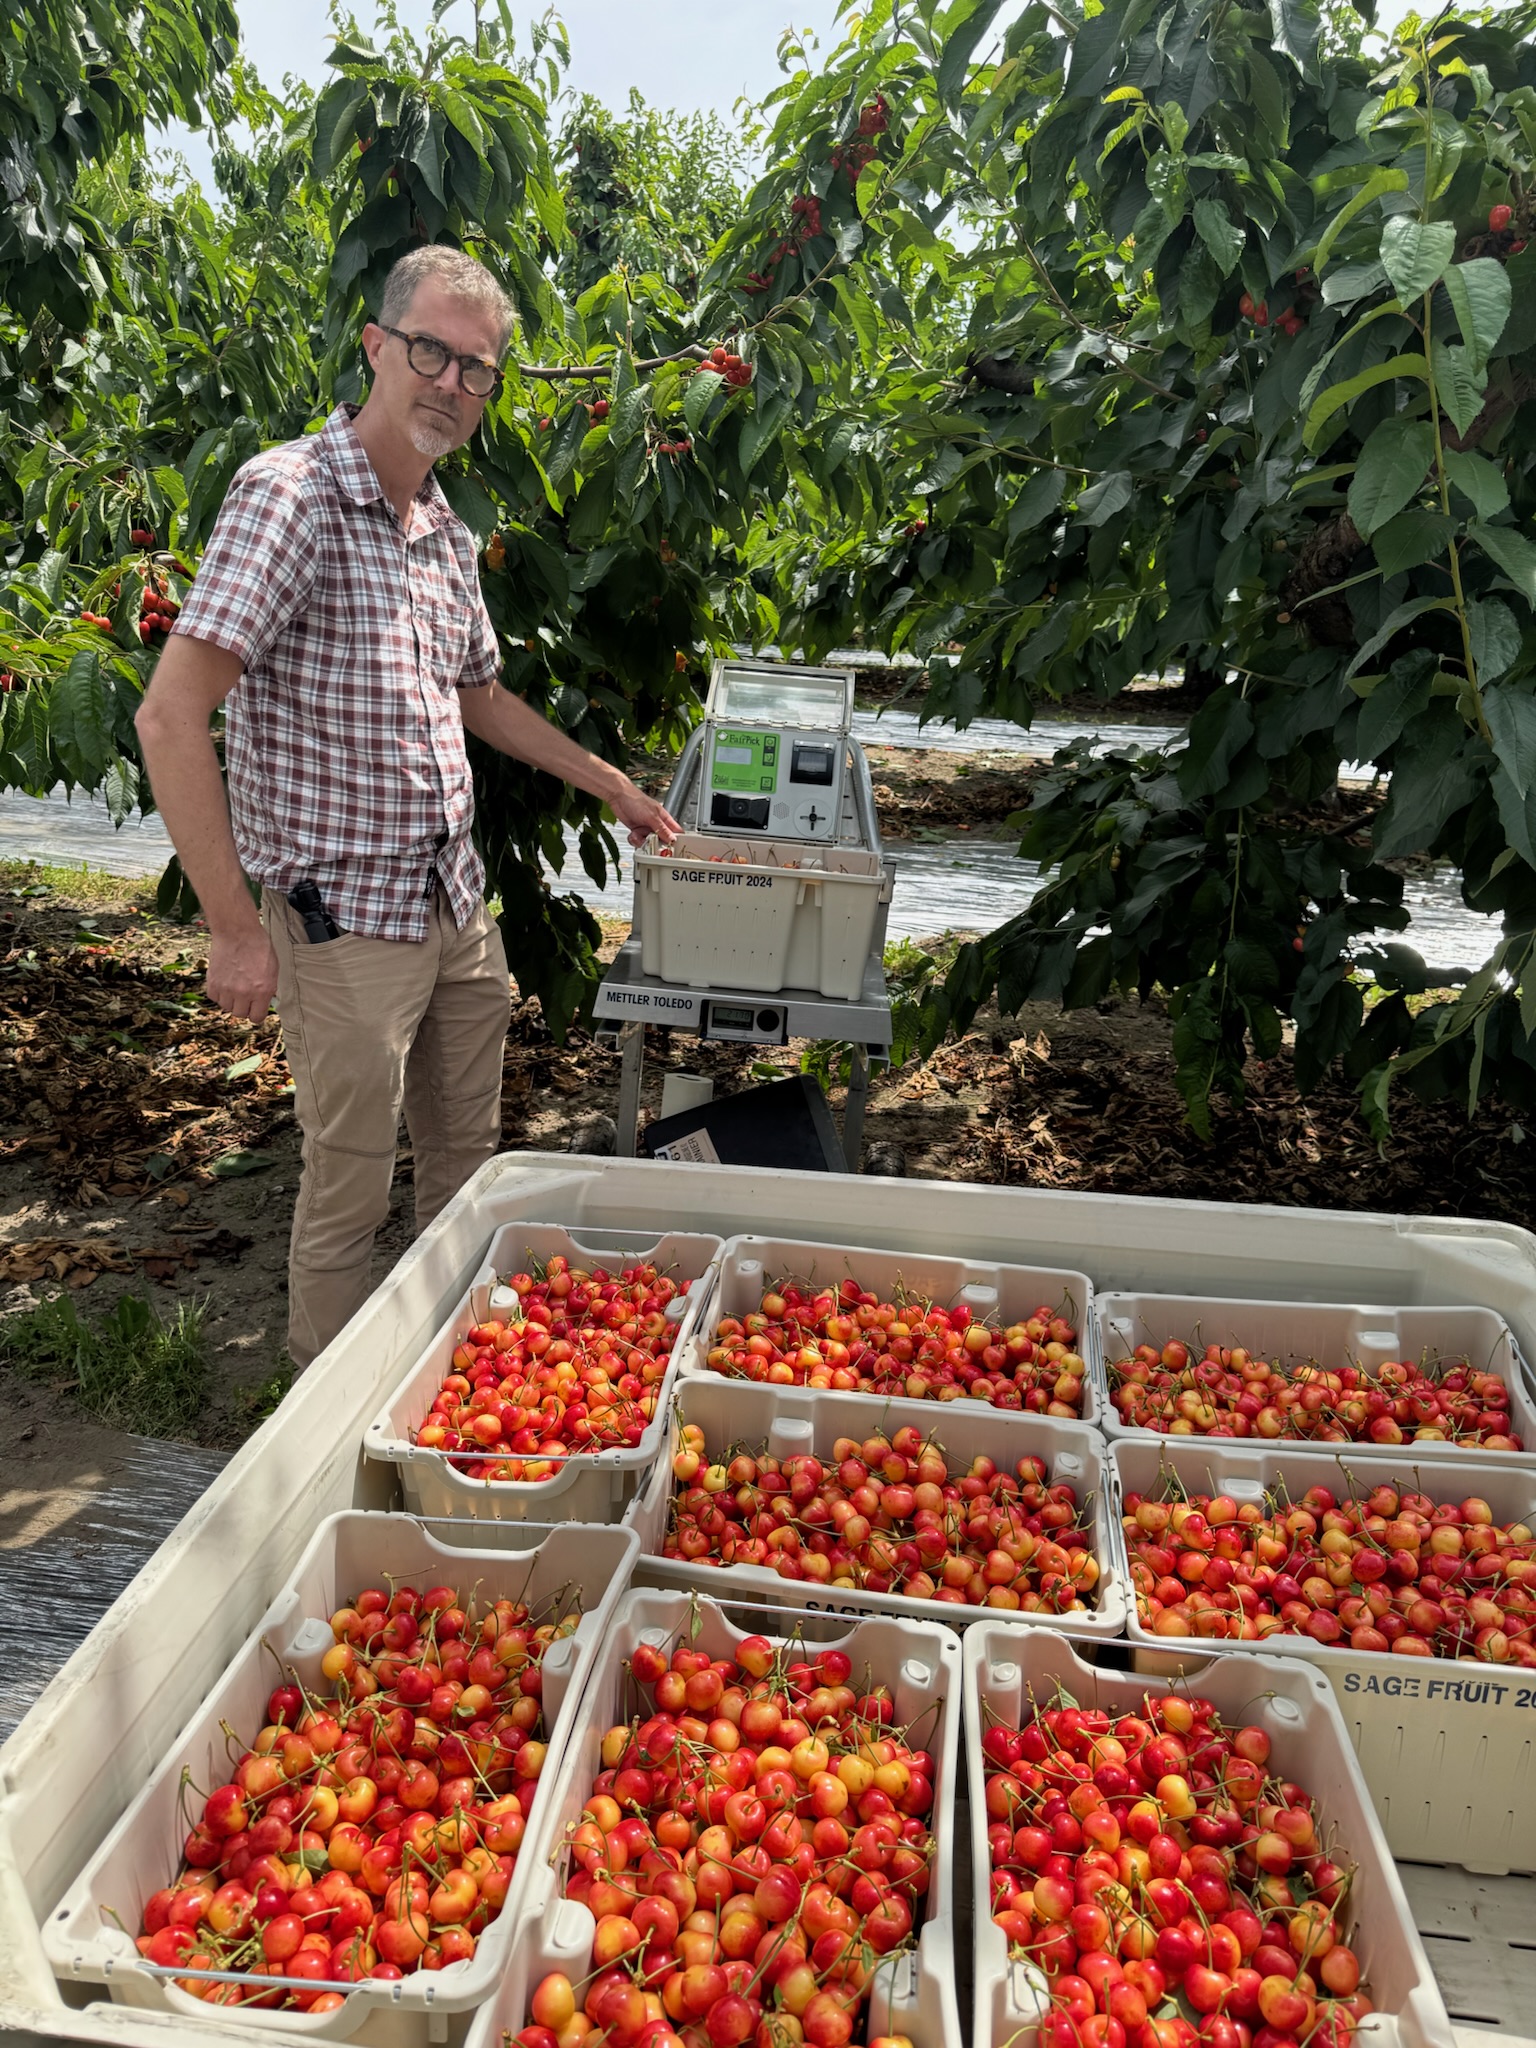
Onboarding in about 30 minutes using your existing labor data exports. First daily insights within a week of activation. Built for specialty crop growers — blueberries, cherries, and apples.
“We’ve invested in soil testing, labor management, packout and sensing platforms for years. What we haven’t had was anything connecting those puzzle pieces into a single clear picture. In this market, it’s imperative to make better use of what you already have.”
“HarvestReplay pulled six years of my farm’s history into one place, revealing trends across hundreds of acres. Now I can see which blocks are in decline, right-size my labor for each field, and decide whether to rehabilitate or rip out underperforming acres with a lot more confidence.”
Food Safety Economics
What a produce recall actually costs
And how field-to-freezer traceability changes the math — before you ever need it.
Average direct recall cost per event
Total costs vs. direct — brand damage, lost accounts, regulatory burden
Recall scope reduced with lot-level traceability
Not days — to isolate affected lots when an FDA inquiry arrives
Built for the people who run the operation
CFO / Owner
- •Cost-per-unit visibility
- •Daily variance alerts
- •Margin drift detection
$4,500/day savings identified
Farm Manager
- •Shift-time crew visibility
- •Pace-to-goal alerts
- •Block reassignment in real-time
Decisions in 30 seconds
HR / Payroll
- •Automated piece-rate calc
- •Clean payroll exports
- •Dispute-proof records
50-70% less payroll time
Breeders & Nurseries
- •Batch traceability
- •Chain of custody
- •Variety performance tracking
Lab to field tracking
How We Help
Labor & Harvest Operations
Turn verified field activity into real-time operating decisions — pace, bottlenecks, reassignment, and true cost per unit. Payroll exports are a byproduct.
Explore SolutionsField & Crop Insights
Map soil health, forecast yields, and monitor crop health with precision imaging and sensor data.
Explore SolutionsBreeders & Nurseries
Track inventory from the lab to the field with barcode and RFID scanning across your entire operation.
Explore SolutionsOperational Intelligence
Turn verified harvest data into AI-generated audio briefings that reach every decision-maker — before the next shift begins.
Explore SolutionsWhat we are
- Labor-first operational intelligence
- A decision loop: track → detect → recommend → act → verify
- Modular — start with harvest tracking, add what you need
- Connected to precision ag partners when it helps
What we're not
- Not a replacement for your ERP, accounting, or irrigation system
- Not an all-in-one farm management platform
- Not a data warehouse — we focus on decisions, not dashboards
The Challenges Keeping Growers Up at Night
Washington's minimum wage rose 81% from 2013 to 2025 — while retail fruit and vegetable prices climbed only 23%. Growers absorb the gap. FairPick and FairTrak create the operational baseline so managers and owners can intervene daily — before small inefficiencies become budget killers.
See Labor Solutions →U.S. farm bankruptcies rose to 315 in 2025 — up 46% year over year. We help you surface cost-per-unit and productivity drift early enough to respond.
CFO & Owner Solutions →
avg direct recall cost — and 10× more in brand damage
Average direct cost of a single food recall — and your buyers know it.
The food industry spent $1.9 billion on recalls in 2024 alone, and hospitalizations from recalled food doubled year over year. Major retailers aren't waiting for FDA enforcement — Walmart, Costco, and Kroger supplier audits already require lot-level, field-to-shelf chain of custody. Growers who can't produce traceback records in 24 hours lose shelf space. StockTrak gives you barcode- and RFID-linked traceability from harvest bin to pallet — ready for buyer audits today and FSMA 204 compliance when it arrives in July 2028.
See Inventory & Traceability →Up and Running in Days, Not Months
Deploy
We set up FairPick scales, sensors, or scanning hardware on your operation. Most growers are live within a single harvest day.
Collect
Data flows automatically to your dashboard — harvest weights, labor hours, inventory counts, soil readings, and more.
Decide
Act on issues as they emerge: pace vs target, station congestion, block underperformance, and cost-per-unit drift — then reassess within the same shift.

Operate in real time — not after payroll.
Live pace vs target by crew and block (spot misses by 10am, not tomorrow).
Bottleneck alerts (stations backing up, slow blocks, travel-time waste).
Next-best action recommendations (reassign crews, adjust start times, change pick order).
Payroll automation is included. The differentiator is the decision loop.
* Real-time field sync requires FairTrak mobile devices with grower-provided SIM/hotspot for in-field data syncs, plus a subscription to the operational analytics feature.

At 2nd Sight, we've always wanted to not just save growers money, but make them money. Combining our labor and inventory tracking with Innov8.ag's agronomic and yield solutions unveils a new level of insights that can quickly be turned into daily gains.
— Kevin Oldenburg, 2nd Sight Founder & innov8.ag Board Chair
Read the full story →See the difference data-driven decisions make
In Round 1, you manage a harvest crew on instinct. In Round 2, you get live FairPick data — pace, cost-per-unit, and block performance. The gap between rounds is the gap data closes every day on real operations.
Most players improve 8-15%. Top managers hit 20%+. Where will you land?
Block A
Block B
Block C
Gut feel: spread evenly...
Round 1
42.3 lbs
Round 2
47.4 lbs
+12%
with FairPick data
Ready to See What Your Data Can Do?
Whether you're managing 50 acres or 10,000+, we'll show you exactly how innov8.ag fits your operation.