Green Atlas Digital Phenotyping
Precision crop load management — from bud to harvest, tree by tree
Green Atlas measures what satellites and drones cannot — bud counts, bloom density, fruit set, canopy volume, and disease indicators at the individual tree level using ground-mounted LiDAR and high-resolution imaging. Outputs are packaged as equipment-ready instruction sets that drive precision spraying, thinning, pruning, and fertilizer applications directly. Founded by PhDs from the University of Sydney's robotics program, validated across 15+ crops and hundreds of thousands of acres globally. Available as a seasonal lease from innov8.ag.
💰 Target thinning to high-load zones instead of blanket applications, match spray volume to actual canopy size, validate pruning strategies with measured response data, and direct capital to blocks with the clearest ROI
What Green Atlas Digital Phenotyping does
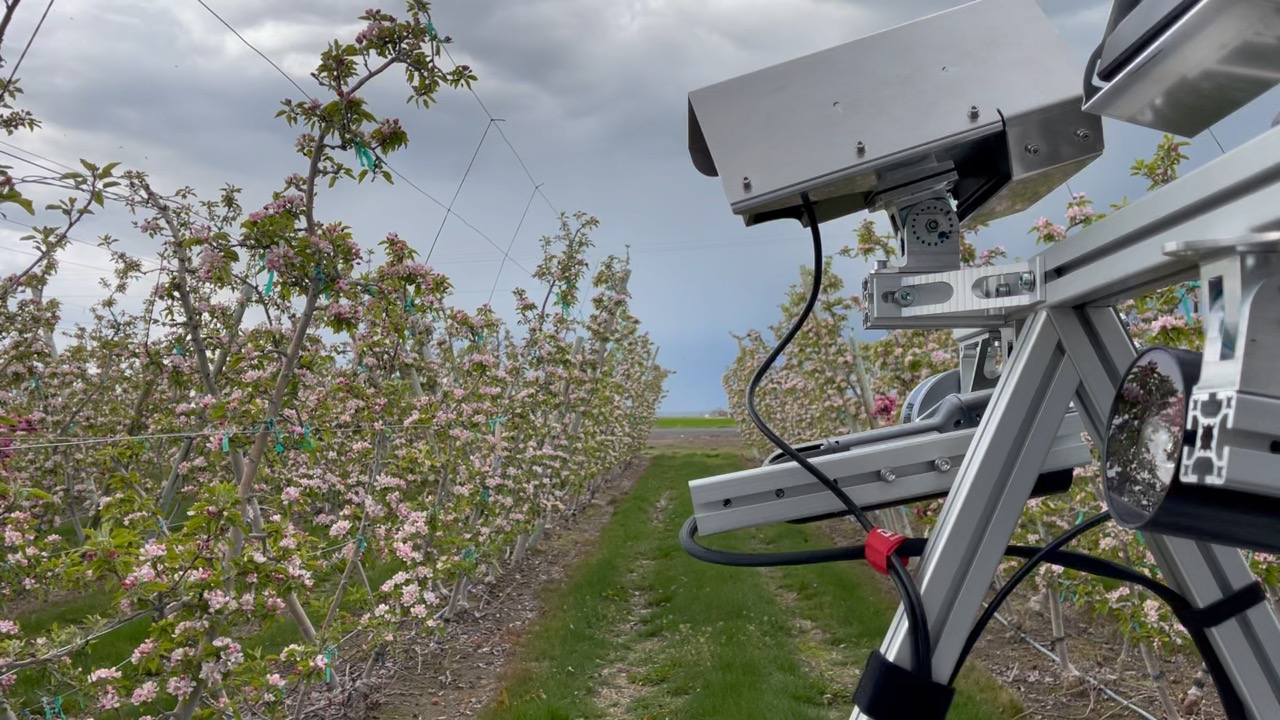
LiDAR & High-Resolution Imaging
The Cartographer captures 300,000 LiDAR points per second and up to 10 high-resolution images per second with patented strobe lighting that works in any light condition — shade, direct sun, or night.
Bud-to-Harvest Phenotyping
Quantify crop load from bud stage through bloom, fruit set, sizing, and color development. Cherry fruitlets detected under 10mm. Fruit count accuracy typically within 5%.
Canopy Volume & Architecture
Measure 3D canopy volume, height, density, cross-sectional leaf area, and structural architecture tree by tree. Millions of LiDAR points per tree reveal what visual scouting cannot.
Variability Mapping & Zone Management
Block-level heat maps reveal spatial variability in crop load, vigor, and canopy structure — identifying management zones for targeted interventions.
Equipment-Ready Instruction Sets
Outputs delivered as GeoJSON and SHP files that drive smart equipment directly — variable-rate sprayers, precision thinning, pruning (plant and root), and fertilizer applications including Red Ant Agri retrofit kits.
Disease & Pest Mapping
Detect and map disease indicators, pest pressure, mummified fruit, and sanitation targets. Localized detection enables targeted treatment rather than blanket applications.
What's included
- Seasonal Green Atlas Cartographer lease
- Onboarding and operator training
- Equipment calibration and validation
- Edge computing hardware for onsite data processing
- Detail Driven web platform access (orchard, block, tree, and geometry views)
- Bud, bloom, fruit count and sizing reports
- Canopy volume and architecture maps
- Equipment-ready output files (GeoJSON, SHP) for smart equipment
- Block-level variability analysis and zone maps
- GeoPDF maps for field staff (GPS-enabled, works offline)
- Data interpretation and integration support
Typical deployment
Implementation time
1-2 weeks
The Cartographer mounts on a side-by-side (SxS), ATV, or autonomous platform like the Burro robot. Equipment is delivered and calibrated for your crop type and row spacing. Your team scans at normal driving speed — 15 acres/hour in orchards, faster in nuts. Edge computing processes data onsite with results typically available next morning. innov8.ag provides ongoing support for calibration, interpretation, and integration with downstream equipment throughout the lease period.
Integrates with
Scan. Analyze. Act.
Green Atlas closes the loop from measurement to action. The Cartographer captures sub-plant structural data. The Detail Driven platform turns it into spatial intelligence. Equipment-ready outputs drive precision operations — no manual interpretation step required.
Scan: Ground-level capture
The Cartographer mounts on a side-by-side, ATV, or autonomous Burro robot. LiDAR captures millions of 3D points per tree while high-resolution cameras image buds, blooms, fruit, and disease — all at normal driving speed. Patented strobe lighting works in any condition.
Analyze: Tree-level intelligence
Edge computing processes data onsite. The Detail Driven platform provides four views — orchard, block, tree, and geometry — with heat maps, variability analysis, and management zone delineation. Fruit count accuracy typically within 5%.
Explore a live demoAct: Equipment-ready outputs
GeoJSON and SHP files drive smart equipment directly — variable-rate sprayers, precision thinning, targeted pruning, and fertilizer applications. Red Ant Agri retrofit kits execute Green Atlas prescriptions on existing equipment.
Explore Red Ant AgriWhere canopy intelligence sits in the system
Weather stations measure conditions. Yield models predict outcomes. Soil maps show what's below ground. Green Atlas measures what's actually happening above ground — and packages that intelligence as instruction sets for your equipment.
Upstream: Soil & environment
SoilOptix maps below-ground variability. METOS weather stations track GDD, moisture, and disease pressure. Together they explain why canopy varies — Green Atlas measures how much.
Explore Soil MappingDownstream: Harvest & yield
Canopy data feeds into Bitwise GreenView yield models and FairPick harvest tracking — connecting what you measured in spring to what you pick in summer.
Explore Yield ForecastingExecution: Smart equipment
Green Atlas zone maps and prescription files feed directly into variable-rate sprayers and spreaders — including Red Ant Agri Smart Node retrofit kits distributed by innov8.ag.
Explore Variable Rate ApplicationNot satellite. Not drone. Ground-level structural data.
Satellite NDVI and drone imagery capture top-down reflectance — useful for broad vigor assessment, but unable to resolve within-canopy structure. Green Atlas operates at the row level with LiDAR capturing 300,000 range points per second and cameras capturing up to 10 high-resolution images per second with patented strobe lighting.
What overhead sensors see
- Canopy color and reflectance
- Broad vigor zones
- Relative greenness
- 2D coverage estimates
What Green Atlas measures
- 3D canopy volume, height, density, and shape
- Bud counts, bloom density, fruit set per tree
- Fruit size distribution and color development
- Disease indicators and sanitation targets
- Structural architecture and pruning response
- Tree-by-tree variability within rows
Peer-reviewed and independently validated. Explore the data yourself →
Backed by science. Proven in the field.
Green Atlas was founded by PhDs from the University of Sydney's Australian Centre for Field Robotics (ACFR) — one of the world's largest robotics research groups. The platform is built on a decade of peer-reviewed research in AI, machine learning, and machine vision, with independent validation published in scientific journals including Acta Horticulturae and Scientia Horticulturae.
Research validation
- Peer-reviewed accuracy: fruit count prediction errors under 6.5%, best at 2.2% standard error
- Agriculture Victoria validation at Tatura SmartFarm
- Independent validation across apples, pears, cherries, stone fruit, and avocados
innov8.ag field deployment
- Integral part of Smart Orchard since its inception
- Core technology in the USHBC BerrySmart Fields initiative
- Oregon State University blueberry mapping research
- Over 2 petabytes of scan data collected by innov8.ag alone
- Actively used by leading-edge blueberry and tree fruit growers and breeders who treat gold-standard data as the baseline for actionable insight
Flexible deployment. Your operation, your platform.
The Cartographer's modular design adapts to how your operation works. Mount it on whatever moves through your rows.
Standard mounting platform. Your team drives through rows at normal speed — scanning 15 acres/hour in orchards, faster in tree nuts. Battery exceeds 10 hours.
Fully autonomous scanning without a driver. The Burro navigates orchard rows using LiDAR, GPS, and computer vision — scanning regardless of re-entry restrictions or labor availability.
Data is processed locally — no cloud upload delays. Results typically available next morning. Equipment-ready output files (GeoJSON, SHP) ready for your sprayers and spreaders.
Calibration, data interpretation, and integration with downstream systems — FairPick for harvest tracking, Bitwise GreenView for yield models, Red Ant Agri for variable-rate execution.
15+ crops. Hundreds of thousands of acres.
Green Atlas is not a single-crop tool. The Cartographer platform delivers detailed analytics across a broad range of perennial crops, with continuous expansion driven by a global network of service providers across five continents.
Pome & stone fruit
- Apples
- Pears
- Cherries
- Peaches & nectarines
- Plums & apricots
Berries & vine
- Blueberries
- Wine grapes
- Table grapes
- Kiwifruit
Tree nuts & tropical
- Almonds
- Walnuts & pistachios
- Macadamias
- Avocados
- Citrus & mangoes
Where Green Atlas Digital Phenotyping fits in your operation
Green Atlas provides sub-plant structural data that connects environmental conditions to what the crop is actually doing — and packages that intelligence as equipment-ready instruction sets for precision action.
Capture field conditions
METOS weather stations measure environment at the block level. Green Atlas Cartographer maps canopy structure, crop load, and fruit development. SoilOptix reveals soil variability. Together, these sensing layers ground every downstream decision in real field data.
Turn data into intelligence
Bitwise GreenView models ripening curves and berry yield volume for harvest and labor planning. Green Atlas analytics reveal spatial variability in canopy and crop load. SWAN Systems models irrigation needs from environmental and soil data.
Optimize & execute decisions
SWAN Systems translates environmental and crop data into precise irrigation schedules. Green Atlas prescription maps target inputs to the zones that need them — spray, fertilizer, thinning, and pruning.
Precision application
Red Ant Agri Smart Nodes execute Green Atlas and SoilOptix prescriptions on existing equipment — precise variable-rate application of fertilizer, lime, and crop protection with GPS-tracked verification.
Related products
Red Ant Agri
Affordable variable rate application — retrofit your existing sprayers and spreaders
Red Ant Agri Smart Nodes retrofit existing sprayers and spreaders with IoT-enabled variable rate control — turning Green...
Bitwise GreenView
The connective tissue between conditions and decisions
Bitwise GreenView uses computer vision and machine learning to turn GoPro video footage into accurate berry yield foreca...
SoilOptix
See your soil like never before
High-resolution soil mapping that reveals the variability hidden by traditional sampling. 25+ soil property layers drive...
Frequently asked questions
How is Green Atlas different from satellite imagery or drones?
Satellite NDVI and drone imagery capture top-down reflectance — useful for broad vigor assessment but unable to resolve within-canopy structure. Green Atlas operates at the row level with ground-mounted LiDAR capturing millions of 3D points per tree and high-resolution cameras with patented strobe lighting. It measures actual bloom density, fruit count, fruit size, canopy architecture, and disease indicators at the individual plant level. It sees what overhead sensors physically cannot.
What crops does Green Atlas support?
Green Atlas currently delivers detailed analytics for 15+ crops: almonds, apples, avocados, blueberries, cherries, citrus, wine and table grapes, kiwifruit, macadamias, mangoes, pears, pistachios, stone fruit (peaches, nectarines, plums, apricots), and walnuts. The platform is continuously expanding crop coverage across hundreds of thousands of acres globally.
How does the seasonal lease model work?
You lease the Cartographer scanner for the season. It mounts on a side-by-side (SxS), ATV, or autonomous platform like the Burro robot. Your team drives through rows at normal speed — scanning 15 acres/hour in orchards, faster in tree nuts. innov8.ag handles delivery, calibration, edge computing setup, and data interpretation support. No capital equipment purchase required.
What output formats does Green Atlas provide?
The Detail Driven web platform provides orchard, block, tree, and geometry views with heat maps and zone management tools. You can explore an interactive demo at greenatlas.com/applications. For field operations, GeoPDF maps work offline with GPS positioning on tablets. For smart equipment, outputs are delivered as GeoJSON and SHP files that drive variable-rate sprayers (including Red Ant Agri retrofit kits), precision thinning equipment, and targeted fertilizer applications directly.
What is the science behind Green Atlas?
Green Atlas was founded by PhDs from the University of Sydney's Australian Centre for Field Robotics (ACFR), one of the world's largest robotics research groups. The technology is built on a decade of peer-reviewed research in AI, machine learning, and machine vision. Independent validation by Agriculture Victoria has been published in Acta Horticulturae and Scientia Horticulturae. Green Atlas actively engages with researchers worldwide to validate results in the scientific literature.
What decisions does canopy data actually inform?
The most immediate applications are thinning (target high-load zones rather than blanket applications), spray optimization (match volume to actual canopy size via variable-rate equipment), pruning validation (measure canopy response to pruning and root pruning strategies), fertilizer targeting (direct inputs to zones that will respond), and capital allocation (identify underperforming blocks for renovation or replanting). When combined with harvest data from FairPick and yield forecasts from Bitwise GreenView, canopy intelligence becomes a direct input to labor planning and margin analysis.
Can breeders use Green Atlas for phenotyping?
Yes. Green Atlas enables objective, repeatable trait measurement at commercial scale — canopy architecture, bloom load, fruit set, fruit size, and vigor across varieties and environments. This supports data-driven selection and reduces reliance on subjective visual scoring. Oregon State University uses Green Atlas for blueberry mapping research. When combined with harvest and yield data, it creates a quantitative feedback loop from genetics to field performance.
Ready to get started with Green Atlas Digital Phenotyping?
Most growers are up and running within 1-2 weeks. See how Green Atlas Digital Phenotyping can work for your operation.